bycycle.plts.plot_feature_categorical
- bycycle.plts.plot_feature_categorical(df_features, param_label, group_by=None, ax=None, **kwargs)[source]
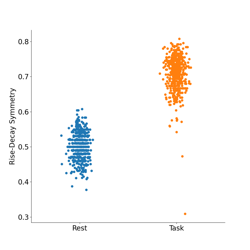
Plot a cycle feature by one or more categories.
- Parameters:
- df_featurespandas.DataFrame
Dataframe output from
compute_features().- param_labelstr
Column name of the parameter of interest in
df_features.- group_bystr, optional
Dataframe column name of a grouping variable to split plotting by.
- axmatplotlib.Axes, optional
Figure axes upon which to plot.
- **kwargs
Keyword arguments to pass into matplotlib.pyplot.scatter.
Notes
Default keyword arguments include:
xlabel: list, default: [1, 2, 3…]ylabel: str, default:param_labelfigsize: tuple of (float, float), default: (10, 10)fontsize: float, default: 20
Examples
Plot and compare the rise-decay times of two asine signals:
>>> import numpy as np
>>> import pandas as pd
>>> from neurodsp.sim import sim_oscillation
>>> from bycycle.group import compute_features_2d
>>> fs = 500
>>> sigs = np.array([sim_oscillation(5, fs, 10, cycle='asine', rdsym=0.2),
...                  sim_oscillation(5, fs, 10, cycle='asine', rdsym=0.8)])
>>> features = compute_features_2d(sigs, fs, f_range=(8, 12), return_samples=False, n_jobs=2)
>>> features[0]['group'], features[1]['group'] = 'low', 'high'
>>> df_features = pd.concat([features[0], features[1]])
>>> plot_feature_categorical(df_features, 'time_rdsym', group_by='group')