bycycle - cycle-by-cycle analysis of neural oscillations


![]()
![]()


![]()
ByCycle is a module for analyzing neural oscillations in a cycle-by-cycle approach.
Overview
bycycle is a tool for quantifying features of neural oscillations in the time domain, as opposed to the
frequency domain, using a cycle-by-cycle approach. Rather than applying narrowband filters and other methods
that use a sinusoidal basis, this approach segments a recording into individual cycles and directly measures
each of their properties including amplitude, period, and symmetry.
This is most advantageous for analyzing the waveform shape properties of neural oscillations. It may also provide advantages for studying traditional amplitude and frequency effects, as well. Using cycle properties can also be used for burst detection.
A full description of the method and approach is available in the paper below.
Documentation
Documentation for bycycle is available on the
documentation site.
This documentation includes:
Dependencies
bycycle is written in Python, and requires >= Python 3.7 to run.
It has the following dependencies:
neurodsp >= 2.1.0
numpy >= 1.18.5
scipy >= 1.4.1
pandas >= 0.25.3
matplotlib >= 3.0.3
There are also optional dependencies, that offer extra functionality:
Install
The current major release is the 1.X.X series, which is a breaking change from the prior 0.X.X series.
Check the changelog for notes on updating to the new version.
Stable Version
To install the latest stable release, you can use pip:
$ pip install bycycle
ByCycle can also be installed with conda, from the conda-forge channel:
$ conda install -c conda-forge bycycle
Development Version
To get the latest, development version, you can get the code using git:
$ git clone https://github.com/bycycle-tools/bycycle
To install this cloned copy, move into the directory you just cloned, and run:
$ pip install .
Editable Version
To install an editable, development version, move into the directory you cloned and install with:
$ pip install -e .
Reference
If you use this code in your project, please cite:
Cole SR & Voytek B (2019) Cycle-by-cycle analysis of neural oscillations. Journal of neurophysiology
122(2), 849-861. DOI: 10.1152/jn.00273.2019
Direct Link: https://doi.org/10.1152/jn.00273.2019
Contribute
This project welcomes and encourages contributions from the community!
To file bug reports and/or ask questions about this project, please use the Github issue tracker.
To see and get involved in discussions about the module, check out:
the issues board for topics relating to code updates, bugs, and fixes
the development page for discussion of potential major updates to the module
When interacting with this project, please use the contribution guidelines and follow the code of conduct.
Quickstart
The classes in bycycle are Bycycle, which takes a time series and some
parameters as inputs, and returns a table of features for each cycle. BycycleGroup
may be used when working with 2d and 3d signals.
For example, consider having a 1-dimensional numpy array, sig, which is a neural signal time series
sampled at 1000 Hz (fs) with an alpha (8-12 Hz, f_range) oscillation. We can compute the table
of cycle features with the following:
from neurodsp.sim import sim_bursty_oscillation
from bycycle import Bycycle

# Simulate
fs = 1000

f_range = (8, 12)

sig = sim_bursty_oscillation(10, fs, freq=10)

# Fit
bm = Bycycle()

bm.fit(sig, fs, f_range)

bm.df_features
The above example used default parameters to localize extrema and detect bursts of oscillations. However, it is important to knowledgeably select these parameters, as described in the algorithm tutorial.
The following example introduces some potential parameter changes:
thresholds = {
    'amp_fraction_threshold': .2,
    'amp_consistency_threshold': .5,
    'period_consistency_threshold': .5,
    'monotonicity_threshold': .8,
    'min_n_cycles': 3
}

narrowband_kwargs = {'n_seconds': .5}

bm = Bycycle(
    center_extrema='trough',
    burst_method='cycles',
    thresholds=thresholds,
    find_extrema_kwargs={'filter_kwargs': narrowband_kwargs}
)

bm.fit(sig, fs, f_range)
center_extrema determines how the cycles are segmented. ‘T’ indicates the center extrema is a trough, so cycles are segmented peak-to-peak.
burst_method selects which method to use for burst detection. The ‘cycles’ option uses features of adjacent cycles in order to detect bursts (e.g. period consistency, see next item). The ‘amp’ option uses an amplitude threshold to determine the cycles that are part of an oscillatory burst.
thresholds sets the keyword arguments for the burst detection functions. For the
cyclesmethod, there are 5 keyword arguments (see the end of the algorithm tutorial for advice on choosing these parameters).find_extrema_kwargs sets the keyword arguments for the function used to localize peaks and troughs. Most notably, you can change the duration of the bandpass filter (
n_seconds) used during extrema localization (see section 1 of the algorithm tutorial)
DataFrame Output
The output of bycycle is a pandas.DataFrame, which is a table, as shown below.
There are many columns, so the table is split into two images here.
Each row of this table corresponds to an individual segment of the signal, or a putative cycle of the rhythm of interest.
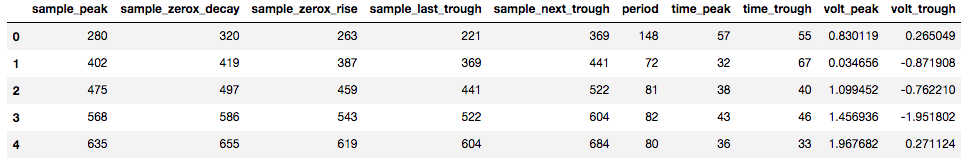
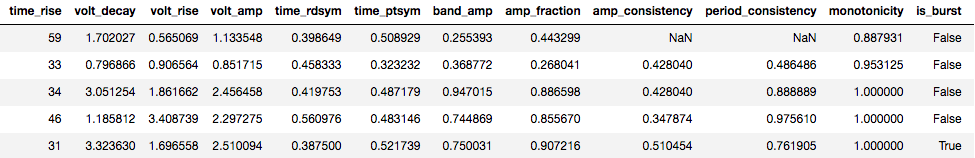
Columns include:
sample_peak: the sample of the signal at which the peak of this cycle occurs
period: period of the cycle
time_peak: duration of the peak period
volt_amp: amplitude of this cycle, average of the rise and decay voltage
time_rdsym: rise-decay symmetry, the fraction of the cycle in the rise period (0.5 is symmetric)
time_ptsym: peak-trough symmetry, the fraction of the cycle in the peak period (0.5 is symmetric)
period_consistency: consistency between the periods of the adjacent cycles, used in burst detection
is_burst: indicator if the cycle is part of an oscillatory burst
The features in this table can be further analyzed, as demonstrated in the resting state data tutorial and the data example. For example, we may be interested in the distribution of rise-decay symmetry values in a resting state recording, shown below.
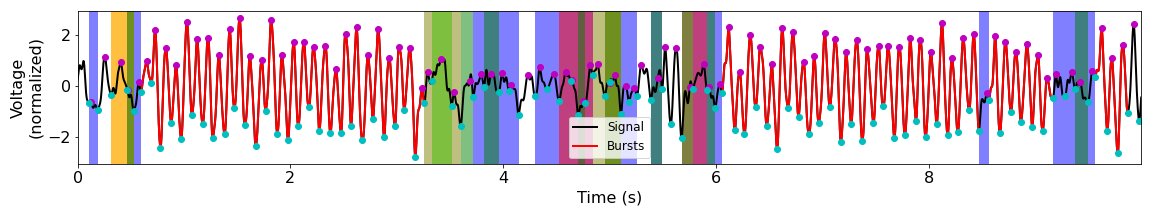
Burst Detection Results
Funding
Supported by NIH award R01 GM134363 from the NIGMS.